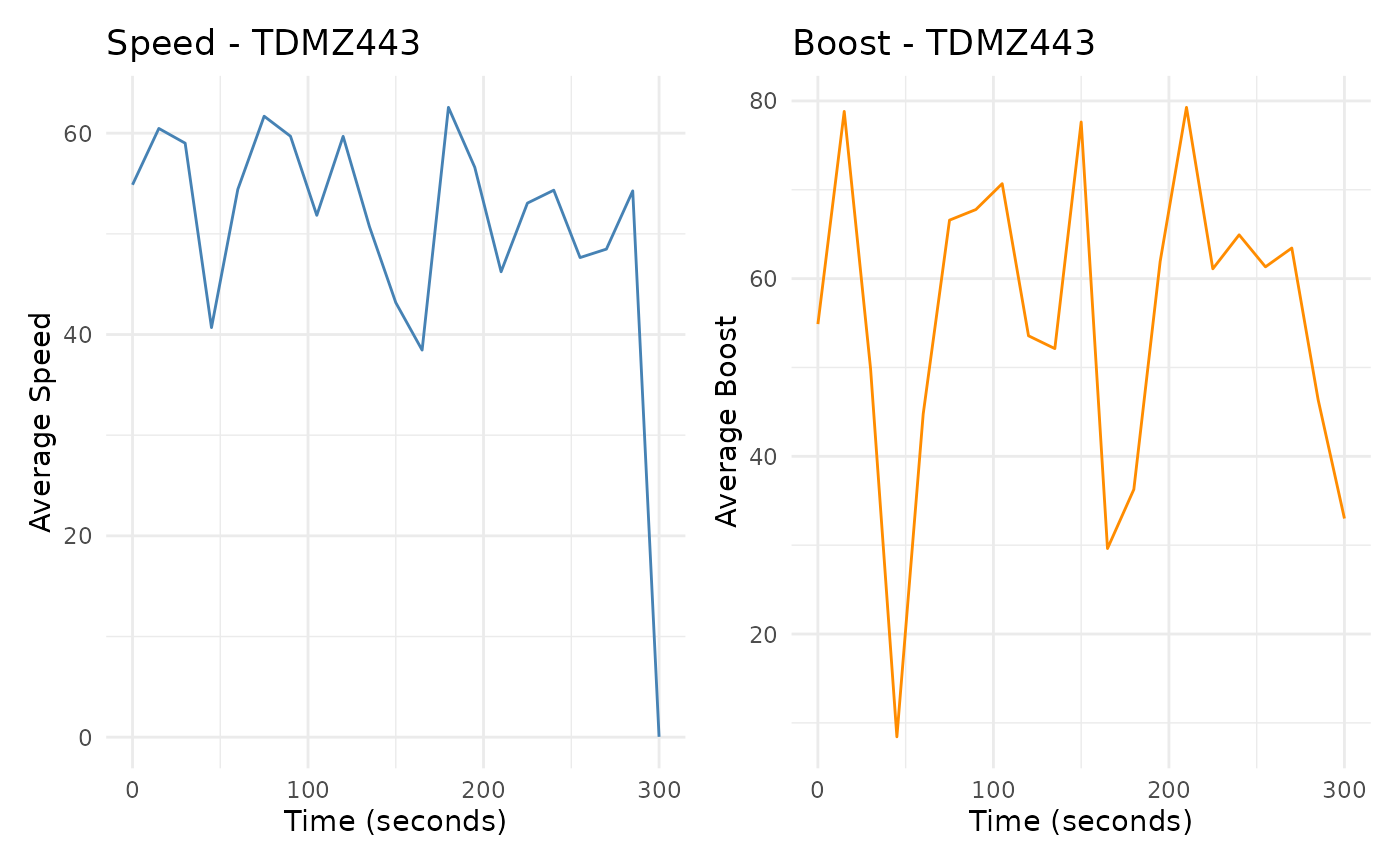
Line plots showing a players boost and speed for a game
Usage
speed_boost_plots(df, name, game)
Arguments
- df
A data frame with data from the rocket league stats api
- name
A string specifying the gamer-tag of the desired player
- game
A string specifying the guid of the desired match to analyze.
Value
Two line plots. One depicting a player's speed over the course of a specified game. The other depicts the players boost total
Examples
speed_boost_plots(TDMZ443games, name = "TDMZ443", "D96D303C11F15617E1F59A8137901B26")